
Growth Persists

Investors closely watch quarterly GDP reports to evaluate the strength and direction of the economy. These reports influence market sentiment, shape expectations for Federal Reserve policy, and offer valuable context for corporate earnings forecasts and portfolio decisions. The second-quarter GDP data showed a significant upside surprise, with the U.S. economy growing at an annualized rate of 3.0% from April through June. This represented a strong rebound from the -0.5% decline in Q1, which was mainly caused by one-time tariff-related inventory distortions. The latest reading greatly surpassed the 2.4% growth predicted by experts, indicating stronger underlying demand and economic resilience.
The 3.0% increase reflects real GDP growth, meaning it excludes inflation. On a nominal basis—which accounts for the effects of price changes—the economy grew at a 5.0% annualized rate, indicating a 2.0% annualized increase in the GDP price index, a broad inflation measure. This mix of solid real growth and moderate inflation could give the Federal Reserve more flexibility to consider future interest rate cuts.
“The combination of strong consumption, declining inventories, and manageable inflation supports continued confidence in economic growth heading into the second half of the year.”
Several factors contributed to the second-quarter surge. A sharp decline in imports was one of the main reasons for the improved growth rate. Businesses had front-loaded inventory purchases in the first quarter before tariffs took effect, causing an unusual spike in imports and a corresponding drag on Q1 GDP, since imports subtract from total output. In Q2, as imports decreased, GDP received a mechanical boost. Private inventories also dropped significantly, as firms sold off stockpiles accumulated before the tariffs rather than replenishing them—behavior that could reverse in future quarters and support additional growth.
Most importantly, consumer spending remained robust, especially in durable goods like motor vehicles and in services such as food, travel, and entertainment. Since household consumption makes up nearly 70% of total GDP, its continued strength is a key indicator of economic health. Other parts of GDP—including business investment, government spending, and exports—were relatively steady and had little impact on the quarter’s overall growth.
Taken together, the data suggest an economy that is both stable and expanding. The combination of strong consumption, declining inventories, and manageable inflation supports continued confidence in economic growth heading into the second half of the year.
Tariffs
In early July, the International Monetary Fund (IMF) announced it was closely monitoring global trade and emphasized the elevated uncertainty. The IMF urged countries to work constructively for a stable trade environment, noting that while economic activity had seen a temporary increase due to front-loading purchases, higher tariffs would bite harder in the second half of the year. The US dollar has depreciated recently, down roughly 7% this year. This could pose an increased risk of inflation, leading companies to pass on tariff costs to consumers and businesses.
The US trade deficit narrowed significantly in June to a two-year low, mainly due to a sharp drop in consumer goods imports. This contributed to the second quarter US GDP rebounding with a stronger-than-expected 3% growth rate. However, underlying indicators suggested weakening activity, particularly in the services sector, which showed signs of softening due to tariff policy uncertainty and rising input costs.
The Trump administration has finalized trade deals with many countries, including Vietnam, Japan, South Korea, Malaysia, and many others, but global trade uncertainty is still highly elevated. A major deal with the European Union was announced on July 28, which includes a 15% tariff on most EU goods, commitments from the EU to purchase US energy products and invest in the US, and reduced EU tariffs on some US goods.
One other major tariff-related headline was that President Trump recently signed an executive order extending the tariff truce with China for another 90 days, pushing negotiations into the fall, and stated that the US was “getting very close to a deal” with China.
The US government collected nearly $30 billion in tariff revenue in July, according to the Treasury Department, which is a major jump of around 240% compared to July of last year. At this rate, the imposed tariffs are expected to generate a substantial amount of revenue for the government in the coming years. However, there is clearly still major uncertainty around the potential negative effects of tariffs on the US economy and consumer prices.
Inflation & Jobs
The inflationary environment and data releases over the last couple of months have been in a transitional state due to the evolving global trade landscape. Heading into July, investor hopes for an immediate rate cut were largely quashed as inflation showed an uptick in the June data. Both the Consumer Price Index (CPI) and the Fed’s preferred inflation measure, the Personal Consumption Expenditures, or PCE index, came in hotter than expected in June. Fed Chair Jerome Powell acknowledged that “higher tariffs have begun to show through more clearly to prices of some goods,” though the overall impact on the economy and broader inflation remained uncertain.
As we moved through July, the latest inflation data presented an increasingly complex picture. Headline CPI was slightly less than expected, remaining at 2.7% annually. However, Core CPI was slightly greater than expected on an annualized basis. Although certain categories were clearly impacted by inflationary pressures, the market reacted very positively to these results. Following the July CPI report, investors placed a 90% probability on a .25% Fed rate cut in September.
Although inflation has been a major focus recently, the latest job market data release caused quite a spectacle. The latest jobs data revealed much weaker-than-expected payrolls added in July, but the major news was a significant and abnormal downward revision to the May and June numbers.
President Trump further escalated the situation by firing the commissioner of the Bureau of Labor Statistics (BLS), whom he accused of “faking” numbers. He then nominated a new commissioner, stating he “will ensure that the Numbers released are HONEST and ACCURATE”. This move has drawn sharp criticism from economists and former BLS leaders, who warn it undermines the independence and integrity of federal statistical systems.
Federal Reserve
There is still much uncertainty plaguing the economy, jobs, and inflation, which could lead the Fed to a situation where it needs to reduce interest rates quite dramatically. This isn’t the best outcome for a variety of reasons, and it would surely make the Fed’s job more difficult.
President Trump has been consistently pressuring Powell, repeatedly calling for lower interest rates to stimulate the economy. This pressure intensified with calls for Powell’s resignation and scrutiny of the Fed’s $2.5 billion headquarters renovation, which Trump and his allies have criticized as mismanaged, costly, and potentially involving fraud.
“By holding rates steady and emphasizing data-driven decisions, the Fed is signaling its commitment to stability while keeping future options open.”
Despite the ongoing pressure from the White House, the Fed has remained steadfast in its approach. At its July meeting, the Fed held interest rates steady for the fifth consecutive time, maintaining the benchmark rate in the range of 4.25%-4.5%. Notably, two Fed governors dissented from the decision, advocating for a quarter-percentage-point cut, marking the first time two governors have dissented simultaneously in over three decades.

Fed Chair Powell emphasized that no decisions have been made about a September cut, stating that more time and data are needed to assess the full impact of tariffs on inflation and the economy. He reiterated the Fed’s commitment to keeping inflation under control, asserting that acting too soon could risk inflation not being fully fixed. Yet, with the recent job data and revisions, the market is now expecting a rate cut in the next Fed meeting.
Stocks
Stocks had another great month in July, continuing the rally. The job market data, specifically the downward revisions, negatively impacted markets, but stocks still had positive returns for the month. Further, leading into August, stocks have accelerated based in part on the belief that the Fed will reduce rates quite soon based on the latest CPI release. Although the impacts of tariffs are not fully known, the markets seem to be gaining clarity and confidence in the global trade landscape. Markets don’t deal well with uncertainty, so any form of clarity on this topic will likely be a good thing for stocks.
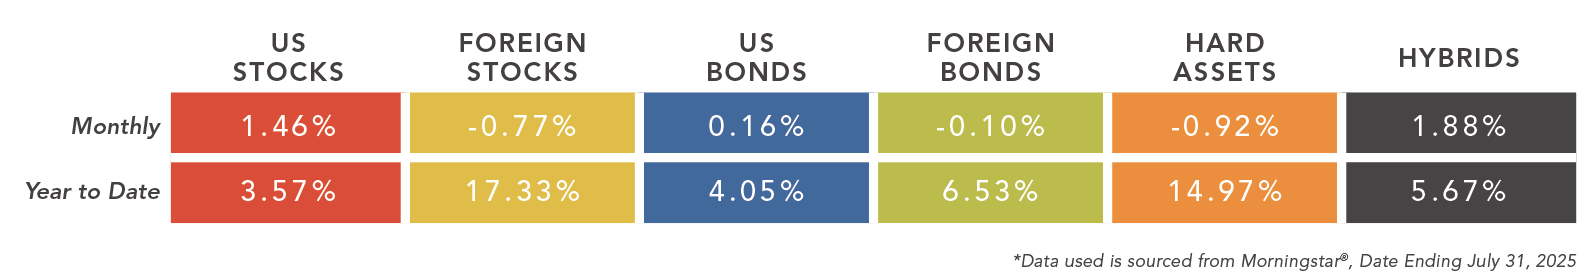
US large cap stocks continued to outperform small caps for the month of July, which widened the year-to-date return gap between the two groups to approximately 12%. Small caps are down for the year and over the trailing one-year period, whereas large caps have posted solid returns over those time frames.
Foreign stocks had mixed results for the month of July; emerging market stocks were positive, whereas most other foreign stock segments declined. Foreign stocks still have a commanding lead over US stocks since the beginning of the year and over a trailing one-year basis. Even three-year average returns are now generally in the same range for US and foreign stocks.
Investors are keeping a keen eye on job and inflation data, trying to gain further clarity on what the Fed’s rate cut cycle may look like. Although there is no shortage of uncertainty for stocks, rate cuts will surely have an impact on the global equity markets.
Bonds
Bonds have swung in multiple directions since the beginning of July. Yields largely increased in the month of July, which generally negatively impacted bond prices. However, bond yields and prices pivoted due to the job market data and the renewed expectation of rate cuts. This caused yields to begin falling. Short-term bond yields have declined more than long-term bond yields, which has led to a steepening of the yield curve. Short-term yields, particularly those on 2-year notes, are highly sensitive to expectations about the Fed’s short-term monetary policy.
The difference in yields between an investment grade corporate bond and a similar-maturity treasury bond is defined as a spread. Investment grade spreads generally widened in early July, influenced by trade tensions and a more uncertain economic outlook. As the market became more optimistic about potential Federal Reserve interest rate cuts, investment grade spreads tightened. Total return for these higher quality corporate bonds has been approximately 4.7% over the last year, which is about .7% higher than treasury bonds of a similar maturity.
High yield, or low-quality bonds continue to be some of the highest-performing bond sectors over the last year, with total returns over 8%. These bonds are still generating interest, or yield of around 7%.
© Advisory Alpha. Registration with the SEC or state does not constitute an endorsement of the firm by regulators, nor does it indicate that the adviser has attained a particular level of skill or ability. This content is for informational purposes only and does not intend to make an offer or solicitation for the sale or purchase of any securities. Investing involves risk, including the potential loss of principal. No investment strategy, such as asset allocation or diversification, can guarantee a profit or protect against loss in periods of declining values. All investment strategies involve risk and have the potential for profit or loss. Changes in investment strategies, contributions or withdrawals, and economic conditions may materially affect the performance of your portfolio. There are no assurances that a portfolio will match or outperform any particular benchmark. Investors should carefully consider the investment objectives, risks, fees, and expenses before investing. Any financial services firms referenced in this material do not provide tax or legal advice. Please consult with your tax or legal professional regarding specific issues prior to making a tax or legal decision.
The performance information presented in the asset category section of this report is based on equal-weighted averages of the following Morningstar Categories: US Stocks (US Fund Large Blend, US Fund Mid-Cap Blend, US Fund Small-Blend), Foreign Stocks (US Fund Foreign Large Blend, US Fund Foreign Small/Mid Blend, US Fund Diversified Emerging Mkts), US Bonds (US Fund Intermediate Government, US Fund Inflation-Protected Bond, US Fund Corporate Bond, US Fund High Yield Bond, US Fund Bank Loan), Foreign Bonds (US Fund World Bond, US Fund Emerging Markets Bond), Hard Assets (US Fund Commodities Precious Metals, US Fund Commodities Energy, US Fund Global Real Estate, US Fund Real Estate), Hybrid Assets (US Fund Convertibles, US Fund Preferred Stock).
© 2025 Morningstar. All Rights Reserved. The information contained herein: (1) is proprietary to Morningstar and/or its content providers; (2) may not be copied or distributed; and (3) is not warranted to be accurate, complete, or timely. Neither Morningstar nor its content providers are responsible for any damages or losses arising from any use of this information. Past performance is no guarantee of future results. Morningstar category data is provided for illustrative purposes only to demonstrate a hypothetical investment vehicle represented by a group of similar investments. Morningstar category data is an aggregation across actual funds contained in the category, but it is not possible to directly invest in a category. Index returns are provided for illustrative purposes only to demonstrate a hypothetical investment vehicle using broad-based indices of securities. Unmanaged indexes are not available for direct investment. All data shown does not include internal fund expenses, trading costs, financial advisor fees or commissions, or taxes. This information is not intended to predict the performance of any specific investment or security. Past performance is no guarantee of future results.
Bureau of Labor Statistics. Unemployment Rate, Total Nonfarm Employment, Labor Force Participation, Consumer Price Index, Producers Price Index. www.bls.gov. United States, Department of Commerce, Bureau of Economic Analysis. Personal Consumption Expenditures, Gross Domestic Product, Consumer Spending, Personal Income and Outlays. www.bea.gov. Federal Reserve. Fed Funds Rate, Fed Funds Target Range, Minutes of the Federal Open Market Committee, Board of the Federal Reserve System Calendar. www.federalreserve.gov. Trump, Donald. @realDonaldTrump. Truth Social.